During the 1980s and 90s, macroeconomic data could not detect the contribution of the emerging computer revolution. Famously, Robert Solow quipped “You can see the computer age everywhere, but in the productivity statistics.” And yet, despite the dot com boom and bust the Magnificent 7 now have a market cap 1.8x that of Europe. A similar issue is arising with AI where the macroeconomic data is not yet equipped to capture the value produced by AI while the headlines, public sentiment, and governments around the world are quick to capture the costs incurred in dollars, watts, gallons and jobs. Matt Drach had an interesting take separately from us on this.
A boring 2013 methodology revision added R&D and investment in intellectual property to GDP accounting boosting total production for the 1990s by ~$3.6T. In the official accounts it was spread evenly, so the growth rate only rose marginally, but it amounted to nearly 30% of full year 2000 GDP. The magnitude of the measurement problem from AI dwarfs prior measurement issues, we call the work AI does that national accounts can’t currently see Dark Output. Even more of the new output from AI is likely to be invisible as it is clustered in the service sector where national statistics have longstanding issues with capturing productivity growth.
Incoming Fed Chairman Kevin Warsh acknowledged as much in December 2025 “If you’re looking at the data, my view is you’re backward looking. You’re going to be late. You’re not going to realize the country is able to have non-inflationary growth faster. So you’re going to have to make a bet.” With the transition of AI growth to more active capital market funding, any measures that fail to show results from AI will be scrutinized for signs of a bubble.
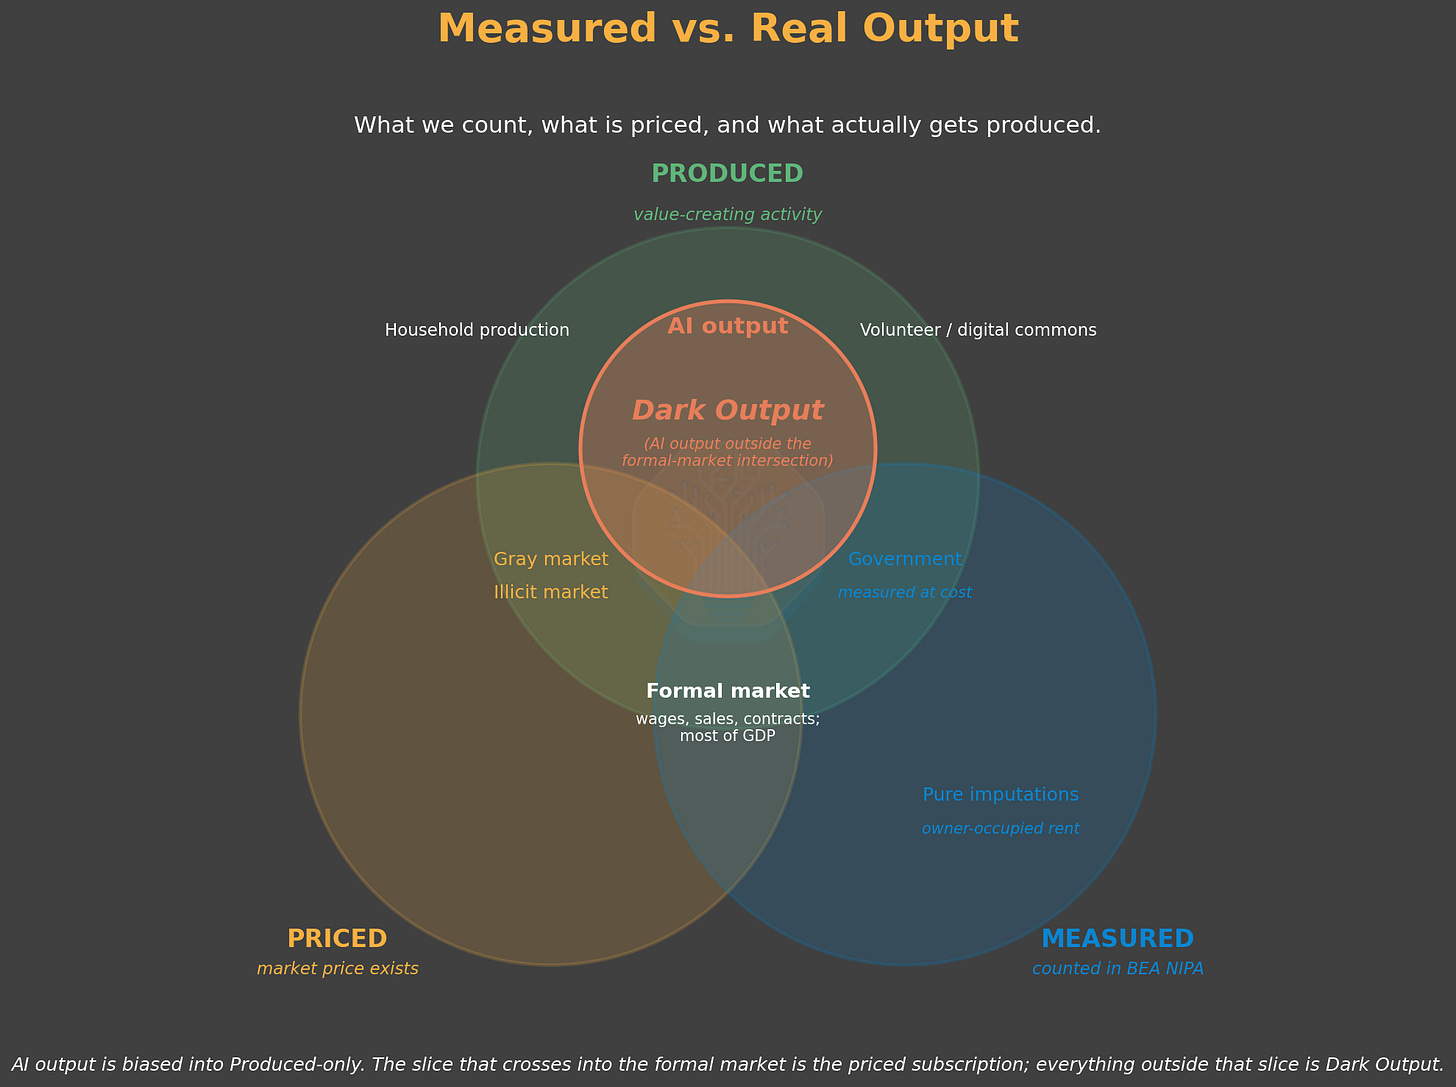
AI output will be real before it is measurable. We can capture token spend, and we can capture jobs lost. But unless AI’s output is sold at a visible price, only token spend is captured in GDP. Normally when the price of something collapses, we can see this deflation and call the results productivity. Due to well-known difficulties in the service sector (see Appendix 1), GDP will record those as declines, and prices may even show inflation. Like the dark energy that makes up our universe, Dark Output will likely only be visible in its effects on other elements of the economy and not through direct observation. One of the most visible effects is job displacement which we are now tracking on our Dark Output Monitor.
Source: SemiAnalysis Tokenomics: Dark Output
We are at risk of having an event on the scale of the Industrial Revolution where most of the new output is invisible even as businesses spend increasingly large amounts on AI services.
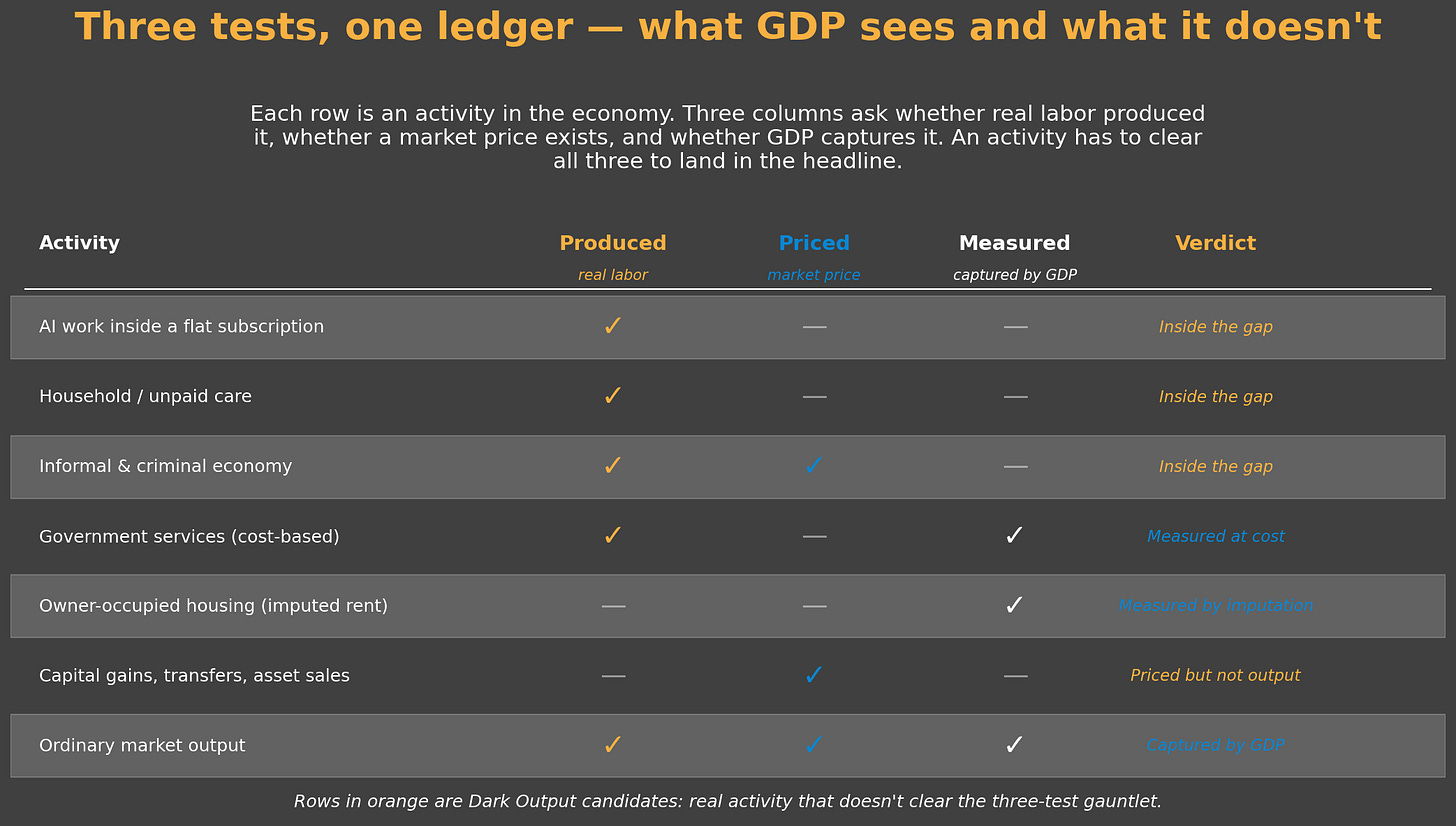
Dark output is AI-enabled economic value that exists but is not visible, or is badly distorted, in GDP, prices, labor statistics, or industry accounts. We categorize this into two buckets:
In both cases, value exists despite the statistical system failing to see it. This is not a unique problem (see Appendix 1).
Source: SemiAnalysis Tokenomics: Dark Output
An example of substitution Dark Output is a simple legal document which in theoretical GDP should have the same inflation adjusted value to a user whether a lawyer drafts it or AI drafts it. But service sector GDP and inflation is hard to estimate (see Appendix 2), there is no ’unit’ of legal services, just lawyers’ receipts and surveys of firms for the cost of services rendered. When AI takes over the task, the receipts vanish as the cost is absorbed in tokens, and when government officials survey lawyers on the cost of services they may find that the average price has gone up, as the simplest documents are now completed by AI and not lawyers. From the perspective of GDP, the transaction has effectively vanished except for a few dollars of tokens sitting in an unrelated sector of the economy.
For Tokenomics subscribers, we track the frontier of tasks that market signals show current AI has the potential to replace. These tasks, depending on how they are performed by AI may vanish from the national accounts all together (see the Dark Output Monitor section below).
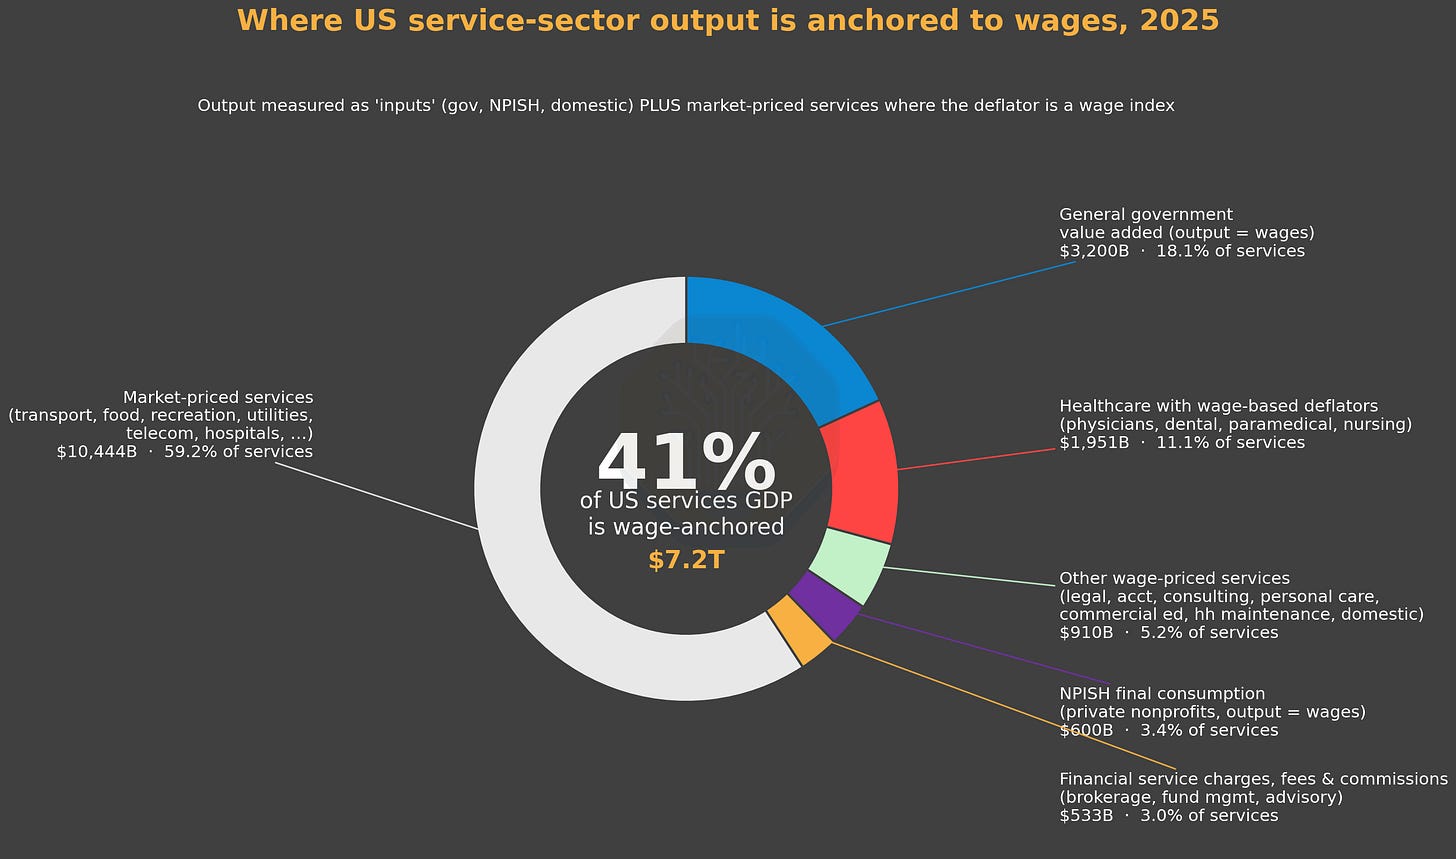
Other than housing, most services are measured in the national accounts through this sort of receipts and list prices system which backs into ‘quantity’ of tasks being done by dividing spend by price. This sort of accounting doesn’t allow for productivity gains. When the accounts record lower receipts, they will read this out as an output decline.
Source: BEA NIPA annual via Haver USNA, 2025. Healthcare wage-anchored = physicians + dental + paramedical + nursing homes (excludes hospitals, transaction-priced via DRG). Market-priced rest includes housing imputed rent and FISIM, which are imputed but not AI-relevant